Normalized Difference Vegetation Index (NDVI) is a spectral index used to quantify the greenness of vegetation. It is used to monitor the health of plants and understand vegetation density. Computing NDVI is done using two bands: the red band and the near-infrared band.
This computation can be easily adapted using the Google earth engine. This blog covers the computation of NDVI for a Sentinel 2 image in the following steps:
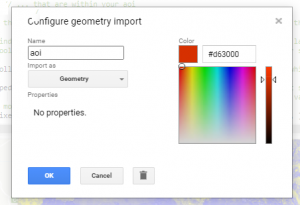
- Selection of the area of interest
This is done using the geometry tool as shown below:
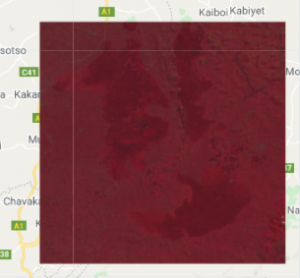
- Selection of the Image collection
The image is selected from the sentinel image collection, and then filtered for clouds to get an image with the least cloud percentage. The date of acquisition, as well as the bounds to the area of interest, is also filtered. The image is as shown below.
1. var collection = ee.ImageCollection('COPERNICUS/S2') // searches all sentinel 2 imagery pixels...
2. .filter(ee.Filter.lt("CLOUDY_PIXEL_PERCENTAGE", 10)) // ...filters on the metadata for pixels less than 10% cloud
3. .filterDate('2017-03-30' ,'2017-07-30') //... chooses only pixels between the dates you define here
4. .filterBounds(aoi) // ... that are within your aoi
5. print (collection) // this generates a JSON list of the images (and their metadata) which the filters found in the right-hand window.
6. /// so far this is finding all the images in the collection which meets the critera- the latest on top. To get a nice blended-looking mosaic,
7. // try some of the tools for 'reducing' these to one pixel (or bands of pixels in a layer stack).
8. var medianpixels = collection.median () // This finds the median value of all the pixels which meet the criteria.
9. var medianpixelsmedianpixelsclipped = medianpixels.clip(aoi).divide(10000) // this cuts up the result so that it fits neatly into your aoi  	                                                                  // and divides so that values between 0 and 1
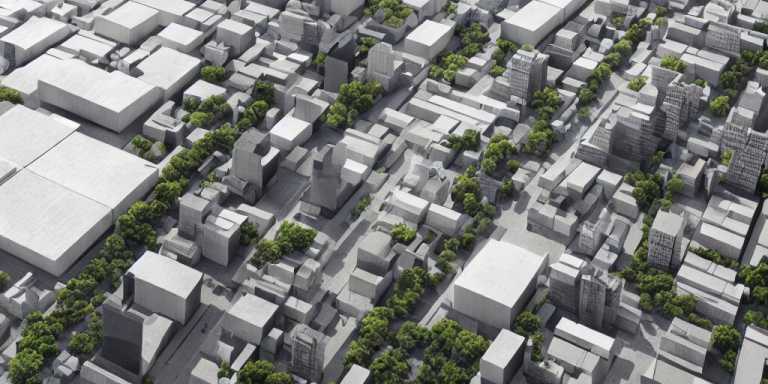
- Visualization
Bands 8, 4, and 3 are used in the visualization of the image in order to display it as a natural color image.
14. // Now visualize the mosaic as a natural color image.
15. Map.addLayer(medianpixelsclipped, {bands: ['B8', 'B4', 'B3'], min: 0, max: 1, gamma: 1.4, }, 'Sentinel_2 mosaic')
- Centering
This is applied in order to center the map to the area of interest.
16. Map.centerObject(aoi);
17. //Map.addLayer(image,truecolor,'Composite');
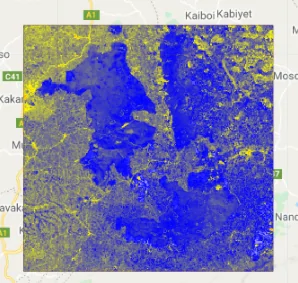
- Computing NDVI
Bands 5 and 4 which are the near-infrared and red bands respectively are used in the computation of NDVI.
18. var bands = ['B2','B3','B4','B5','B6','B8','B9',];
19. // Compute the Normalized Difference Vegetation Index (NDVI).
20. var nir = medianpixelsclipped.select('B5');
21. var red = medianpixelsclipped.select('B4');
22. var ndvi = nir.subtract(red).divide(nir.add(red)).rename('NDVI');
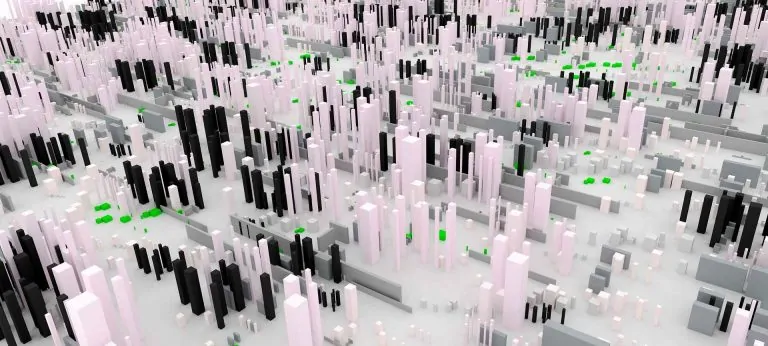
- Displaying the result
The parameters for displaying the image are set as below, and the map is added.
23. // Display the result.
24. //Map.centerObject(selection, 9);
25. var ndviParams = {min: -1, max: 1, palette: ['blue', 'white', 'green','pink', 'red', 'yellow','blue', 'white', 'green', 'black']};
26. Map.addLayer(ndvi, ndviParams, 'NDVI image');
27.
28. medianpixelsclippedmedianpixelsclipped = medianpixelsclipped.addBands(ndvi);
Computing NDVI using Google Earth Engine