The development of web applications is becoming more and more complex yet requirements for the user interface to be reactive are becoming the state of the art. To ease the complexity of building web-GIS applications, it is necessary to find ways that will enhance code modularization, scalability, and maintenance. One of the ways to achieve this is through the use of modern JavaScript frameworks like Vue JS alongside mapping libraries like Leaflet Js. Vue JS is lightweight, making this one of the core principles of its design. Compared to other frameworks like Angular and React, Vue JS has the smallest bundle size among all three frameworks. It is for this reason that Vue Js has become popular more so in rendering Leaflet maps.
Moreover, it is easy to add Vue to an existing project. Its template syntax is similar to HTML, therefore converting existing code is much easier. Vue was inspired by the other two frameworks, i.e. Angular and React. The concept of components was borrowed from React while directives and two-way data binding were borrowed from Angular. Simply put, Vue is a hybrid of the two frameworks because the best parts of each of the two frameworks were taken to come up with an excellent balance of features.
This article will focus on integrating Vue JS with Leaflet and outlining step by step process of displaying a leaflet map using Vue Js.
Install NPM.
Npm is the world’s largest registry used for the management of the development, sharing, and borrowing of packages. Also, npm helps to download and use standalone tools. In this case, we will use npm to install some of the dependencies like leaflet, vue and vue2leaflet. To install npm:
- Open command prompt
- On the command line interface, run the following code:
npm install
Press Enter to run
Install Dependencies
In this case, the dependencies that will be used include leaflet, vue and vue2leaflet. On the CLI, run the following code:
npm install leaflet vue2-leaflet –save
Use the installed dependencies
In your local components, open the App.vue and Main.vue files. In the App.vue file, type the following code inside the <template> tags to add the container for the map display.
<template>
  <div id="app" style="height: 100vh; width: 100%">

    <l-map

      :zoom="zoom"
      :center="center"
      :options="mapOptions"
      style="height: 100%"

    >
      <l-tile-layer
        :url="url"
        :attribution="attribution"
      />


    </l-map>
  </div>
</template>
Inside the script tags, import the previously installed dependencies.
import { latLng } from "leaflet";
import { LMap, LTileLayer} from 'vue2-leaflet';
export default {
  name: 'MyLeafletMap',
  components: {
    LMap,
    LTileLayer,

  },
   data() {
    return {
      zoom: 13,
      center: latLng(-1.3, 36.8),
      url: 'https://server.arcgisonline.com/ArcGIS/rest/services/World_Imagery/MapServer/tile/{z}/{y}/{x}',
attribution:
            'Tiles © Esri — Source: Esri, i-cubed, USDA, USGS, AEX, GeoEye, Getmapping, Aerogrid, IGN, IGP, UPR-EGP, and the GIS User Community',
      withPopup: latLng(-1.3, 36.8),
      withTooltip: latLng(-1.3, 36.8),
      currentZoom: 11.5,
      currentCenter: latLng(-1.3, 36.8),
      mapOptions: {
        zoomSnap: 0.5
      },

    };
  },
};
Apply CSS styling to the map container
#app {
  height: 100vh;
   width: 100%;

}
In the main.js file, import the leaflet css styling
import 'leaflet/dist/leaflet.css';
Run the code and display final results
To run the code, open the terminal of your text editor, type the following code and press enter.
npm run serve
Results
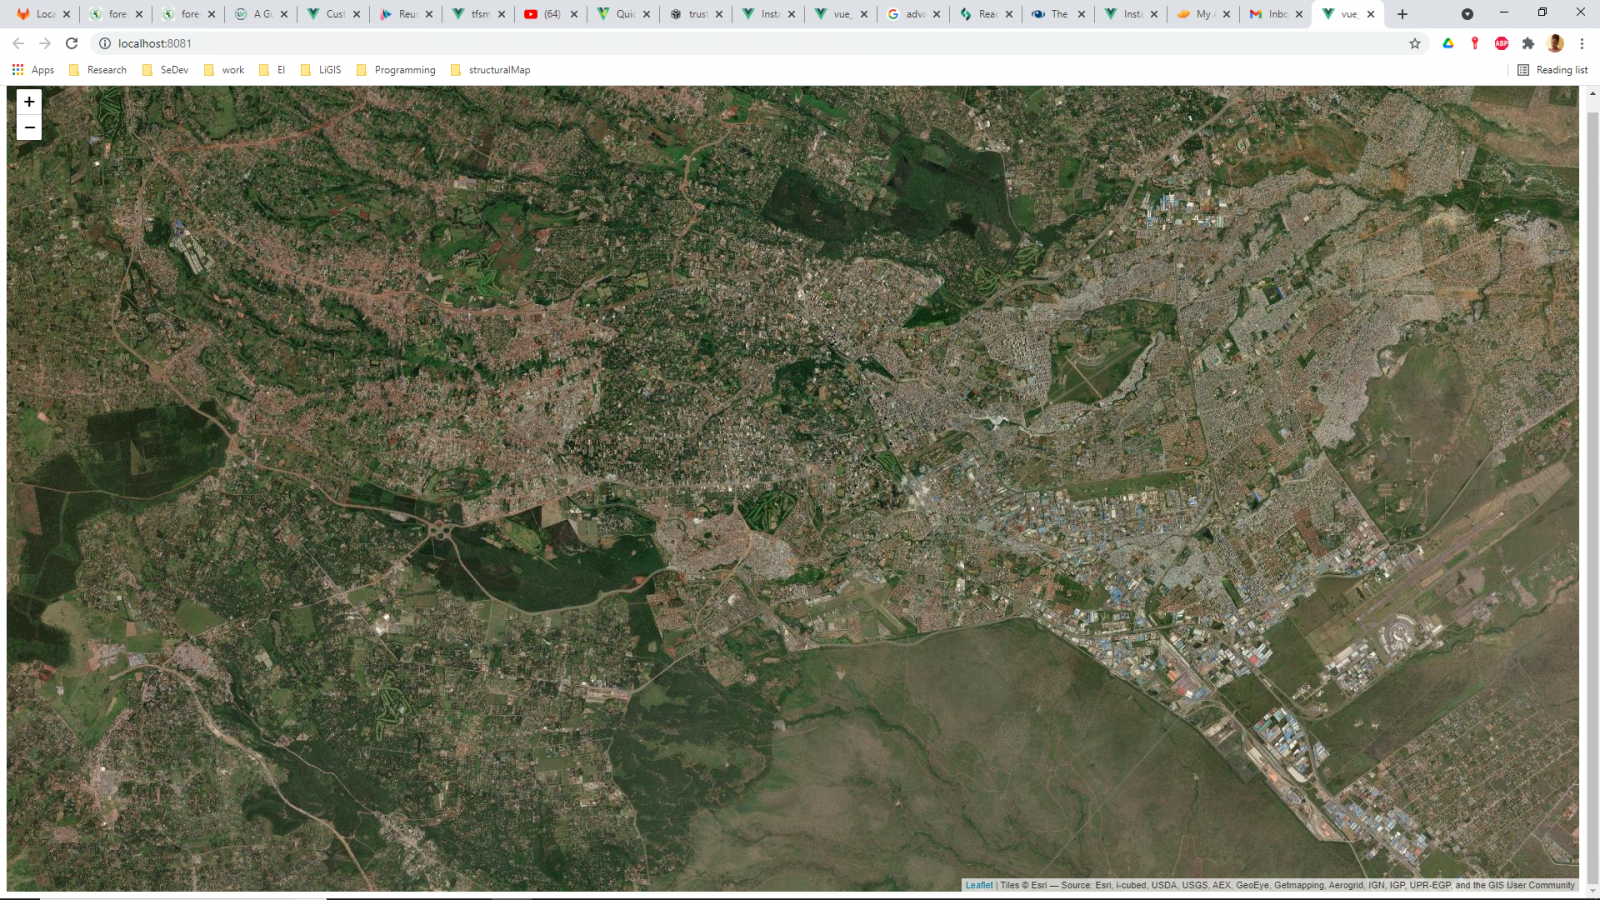


How to display Leaflet maps using Vue JS Framework